
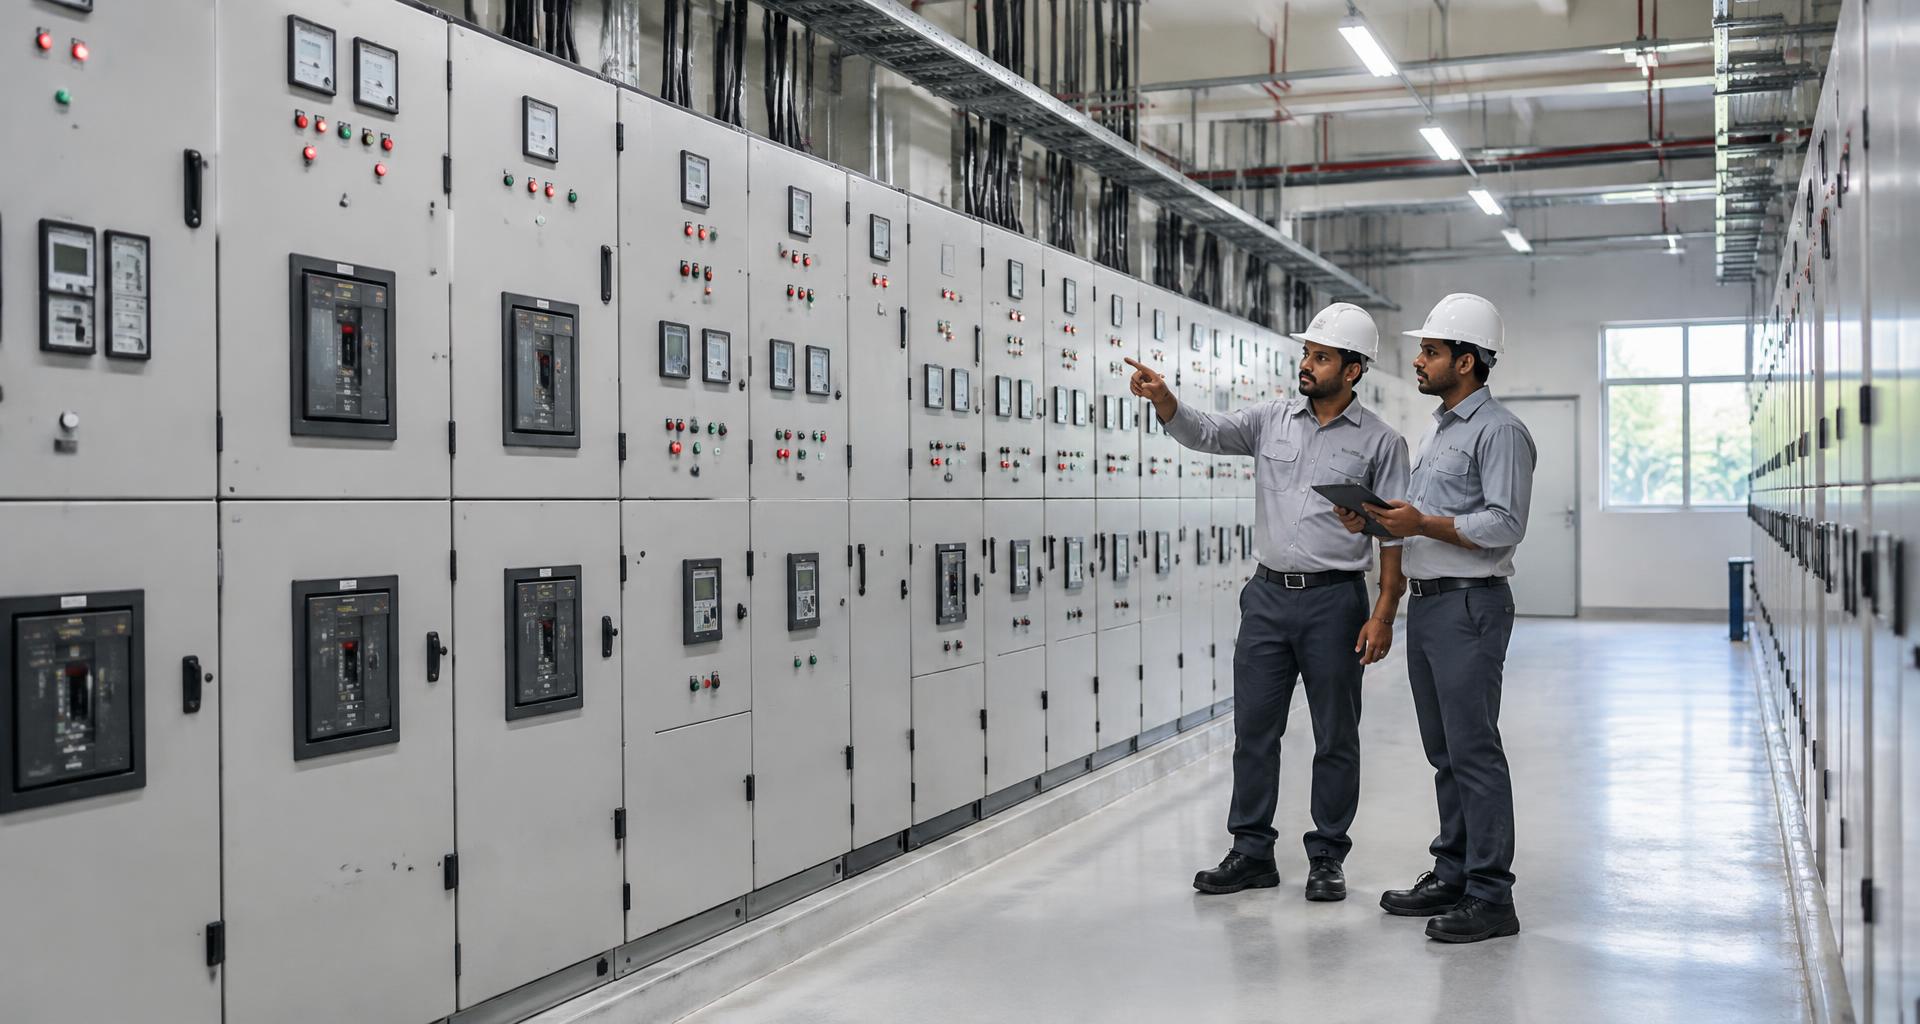
Preventive vs Breakdown Maintenance: Cost & ROI Analysis for Commercial Facilities
A comprehensive financial and engineering analysis comparing preventive and breakdown maintenance models, quantifying MTBF, MTTR, asset lifecycle depreciation, and ROI in commercial facilities.
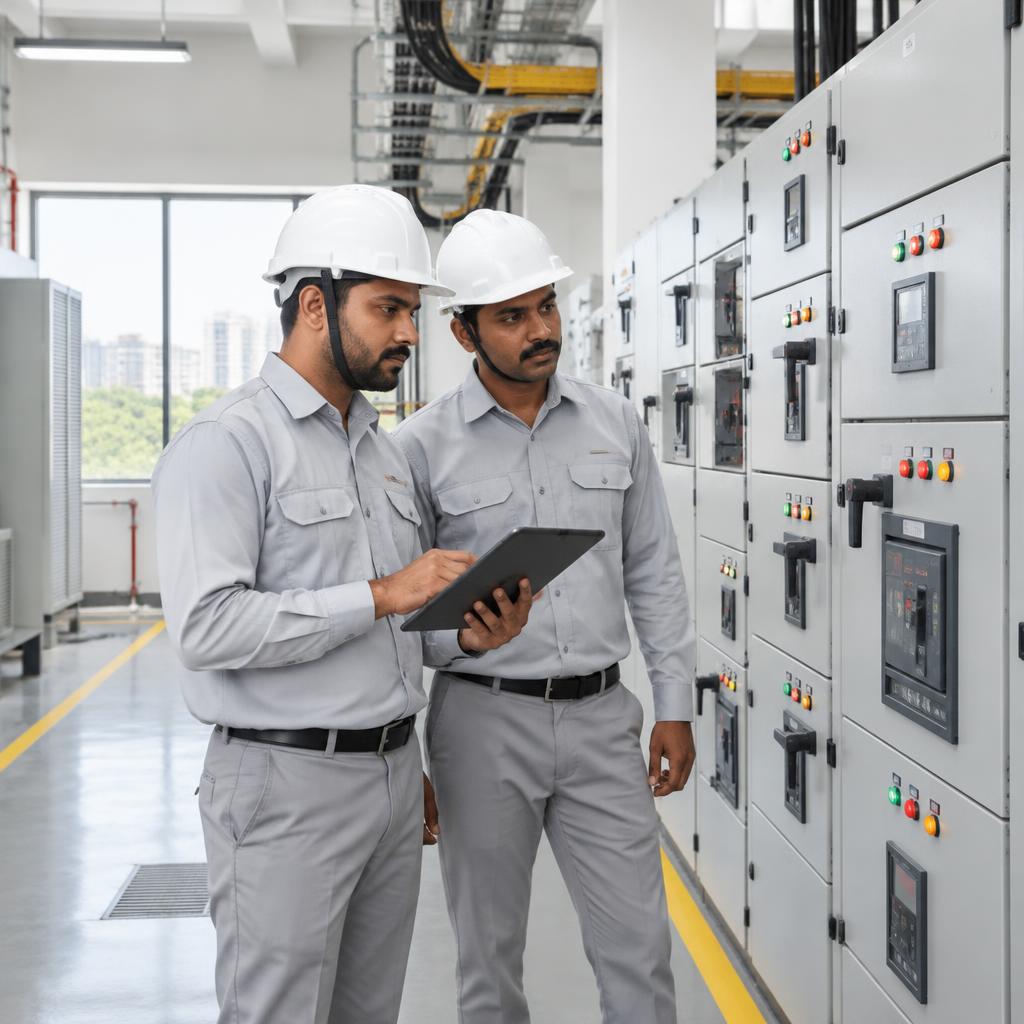
Preventive maintenance delivers a 300% to 540% return on investment (ROI) over breakdown maintenance by extending electro-mechanical asset lifespans by 35%, cutting emergency repair costs by up to 60%, and slashing catastrophic downtime. JTechno Associates implements data-driven predictive and preventive O&M frameworks that optimize Total Cost of Ownership (TCO) across Bengaluru commercial real estate.
Key Engineering Highlights
- Breakdown maintenance costs 3 to 5 times more than scheduled preventive care due to collateral equipment damage and emergency labor surcharges.
- Tracking Mean Time Between Failures (MTBF) and Mean Time to Repair (MTTR) provides quantifiable engineering metrics to evaluate maintenance effectiveness.
- Condition-based monitoring (vibration analysis, infrared thermography, oil BDV tests) detects minor degradation long before catastrophic mechanical failure.
- Unplanned outages in commercial facilities trigger severe indirect costs: tenant SLA penalties, lost workforce productivity, and brand reputation damage.
- Optimizing the preventive maintenance sweet spot achieves maximum asset reliability without incurring unnecessary over-servicing expenses.
The Maintenance Dilemma: Proactive Engineering vs Reactive Firefighting
Commercial real estate developers, asset asset managers, and facility executives across Bengaluru face ongoing budgetary pressures to constrain operational expenditure (OPEX). When looking for opportunities to reduce monthly overhead, maintenance budgets are frequently targeted. Deferring preventive servicing or adopting a reactive 'run-to-failure' policy may appear to conserve capital in the short term, but it represents one of the most financially disastrous strategies a commercial facility can pursue.
Electro-mechanical systems—such as high-voltage transformers, multi-stage centrifugal chillers, commercial UPS modules, and standby diesel generators—are interconnected thermodynamic machines operating under continuous stress. When a minor mechanical defect (such as an unlubricated motor bearing or a loose electrical terminal) is left unaddressed, it does not remain isolated. It initiates a cascading failure sequence that destroys adjacent components, trips upstream electrical protection, and culminates in catastrophic, unbudgeted facility downtime.
The True Financial Anatomy of Breakdown Maintenance (The 1:5 Cost Multiplier)
Industry benchmark data across commercial facilities demonstrates that repairing equipment after a catastrophic failure costs between 300% and 500% more than resolving the same condition during scheduled preventive maintenance. This dramatic cost escalation is driven by four primary financial multipliers.
First, Collateral Damage: when a compressor bearing seizes under load, it bends connecting rods, fractures valve plates, and contaminates the entire refrigerant circuit with burnt acid, transforming a ₹20,000 bearing replacement into a ₹15,00,000 total compressor replacement. Second, Emergency Procurement Premiums: sourcing specialized OEM components overnight requires expedited air freight and overtime vendor labor rates. Third, Collateral Downtime Losses: commercial tenants in IT corridors like Whitefield or the Outer Ring Road lose hundreds of productive engineering hours when cooling or power fails, triggering severe lease penalty clauses and reputational erosion.
- Quantify direct costs: replacement parts, expedited shipping, and third-party emergency contractor fees.
- Measure indirect costs: lost tenant productivity, emergency facility staff overtime, and administrative overhead.
- Calculate opportunity costs: deferred capital improvements and executive management distraction.
- Assess statutory liabilities: fines from environmental or electrical regulators caused by uncontained failures.
- Evaluate asset depreciation: premature write-down of capital equipment forced by chronic unaddressed wear.
Engineering Metrics for Maintenance Health: MTBF, MTTR & OEE
Transitioning from reactive firefighting to a disciplined preventive culture requires tracking standardized engineering performance metrics. The two most fundamental benchmarks are Mean Time Between Failures (MTBF) and Mean Time to Repair (MTTR). MTBF measures operational reliability: the average operating hours an asset runs before experiencing an unscheduled stoppage. A successful preventive maintenance program steadily drives MTBF upward.
Conversely, MTTR measures operational maintainability and response efficiency: the average time required to diagnose, isolate, repair, and recommission a failed asset. High MTTR values indicate poor technical documentation, inadequate on-site spare inventories, or undertrained technicians. In addition, Overall Equipment Effectiveness (OEE)—incorporating Availability, Performance Rate, and Quality Rate—provides facility leaders with a single holistic index of asset productivity.
Condition-Based Predictive Maintenance: The Evolution Beyond Fixed Schedules
While time-based preventive maintenance (servicing equipment on fixed calendar dates or running hours) is vastly superior to reactive breakdown maintenance, modern high-tech facilities are advancing toward Condition-Based Maintenance (CBM) and Predictive Maintenance (PdM). CBM relies on real-time and periodic diagnostic telemetry to service equipment precisely when degradation begins, avoiding the waste of over-servicing healthy components.
Three core diagnostic technologies form the pillar of modern commercial CBM: Infrared Thermography (identifying electrical hotspots caused by high resistance connections before arc flashes occur), Vibration Analysis (detecting dynamic mechanical imbalance, bearing raceway spalling, and shaft misalignment in rotating HVAC equipment), and Fluid Dielectric/Spectrometric Analysis (evaluating transformer oil Breakdown Voltage and chiller compressor oil acidity). Incorporating these non-invasive diagnostic tools into regular monthly rounds enables engineering teams to eliminate 85% of catastrophic electro-mechanical failures.
Financial Modeling & ROI: Building the Business Case for Preventive Care
Securing executive and board-level approval for comprehensive facility maintenance budgets requires presenting maintenance not as a burdensome cost center, but as a high-return capital protection strategy. Financial modeling demonstrates that every rupee invested in disciplined preventive engineering yields an average of ₹3.50 to ₹5.40 in direct cost avoidance over a five-year horizon.
Consider a typical 500,000 sq. ft. commercial IT park in Bengaluru operating two 500-TR water-cooled chillers. A disciplined preventive maintenance program—encompassing eddy current tube testing, quarterly vibration profiling, condenser descaling, and BMS sensor calibration—costs approximately ₹6,00,000 annually. In contrast, avoiding preventive care results in scaled condenser tubes (increasing annual power consumption by 18%, costing an additional ₹28,00,000 in utility bills) and a catastrophic compressor burnout at year 5 (costing ₹22,00,000 in emergency overhaul and ₹15,00,000 in downtime penalties). Over five years, the preventive approach saves over ₹1.2 Crore, delivering an undeniable financial ROI.
| Metric / Parameter | Reactive Breakdown Maintenance | Planned Preventive Maintenance (PM) | Condition-Based Predictive (CBM) |
|---|---|---|---|
| Direct Maintenance Cost | Unpredictable, highly volatile with huge spikes | Stable, budgeted, predictable annual OPEX | Optimized; lowest long-term operational cost |
| Equipment Lifecycle | Shortened by 30% to 45% due to chronic stress | Extends to or exceeds full OEM design lifespan | Maximizes lifecycle; delays capital replacement |
| Unscheduled Downtime | High (frequent catastrophic stoppages) | Low (diminished by 70% to 80%) | Near zero (failures identified and planned ahead) |
| Energy Consumption | High (equipment operates in degraded, inefficient states) | Optimized (clean heat exchangers, calibrated controls) | Peak efficiency maintained continuously |
| Safety & Arc-Flash Risk | Extreme (failures often catastrophic under load) | Controlled (regular safety interlock testing) | Minimal (thermal anomalies isolated pre-fault) |
| Spare Inventory Costs | High emergency shipping premiums and expediting fees | Planned bulk purchasing at negotiated discounts | Just-in-time procurement based on sensor trends |
| Tenant Satisfaction | Poor (chronic cooling failures and power glitches) | High (consistent comfort and power reliability) | Exceptional (transparent uptime SLAs maintained) |
Frequently Asked Technical Questions
What is the industry standard cost multiplier for breakdown maintenance vs preventive maintenance?
Studies across commercial engineering facilities establish a 1:3 to 1:5 cost ratio. Repairing an asset after catastrophic failure costs 3 to 5 times more than the cumulative cost of scheduled preventive servicing, factoring in collateral damage, expedited parts, and lost productivity.
How does Mean Time Between Failures (MTBF) impact facility operational budgets?
A higher MTBF indicates superior equipment reliability and fewer operational interruptions. Increasing MTBF directly reduces emergency repair expenditures, eliminates overtime contractor call-out fees, and prevents tenant lease penalty clawbacks.
Can an asset be over-maintained, and how does Condition-Based Maintenance (CBM) prevent this?
Yes. Excessive disassembly of healthy mechanical machinery can introduce human assembly errors, foreign particle contamination, and seal damage. CBM uses non-invasive diagnostics (vibration, thermography, oil testing) to service equipment only when physical parameters drift from baseline.
How does preventive maintenance contribute to building energy efficiency?
Preventive maintenance keeps heat exchangers descaled, fan belts properly tensioned, motor bearings lubricated, and electrical connections tightened. This eliminates thermodynamic and electrical losses, reducing facility electricity consumption by 10% to 20%.
What is the typical payback period for implementing a comprehensive preventive maintenance program?
The payback period for a comprehensive preventive maintenance program in a commercial building is typically between 6 to 12 months, driven immediately by avoided breakdown repairs and immediate utility bill reductions.
Related Critical Facility Management Services
Integrated Facility Management (IFM)
Data-driven preventive maintenance, vendor consolidation, and comprehensive facility asset management.
Commercial Chiller & HVAC Maintenance
Predictive vibration analysis, tube eddy current testing, and chiller preventive maintenance.
Commercial Diesel Generator AMC
Scheduled B-check/C-check preventive servicing to prevent costly engine seizure and outages.
Electrical Substation O&M Services
HT transformer oil filtration, thermographic inspection, and preventive switchgear calibration.
Engineering standards and operational procedures referenced herein comply with Central Electricity Authority (CEA), CEIG Karnataka, Central Pollution Control Board (CPCB), ASHRAE, and National Building Code (NBC 2016) specifications. Facility assessments by JTechno Associates determine site-specific maintenance scopes for commercial properties across Karnataka.
Ready for zero-surprise uptime?
Start with a conversation. We’ll take it from there.